Adding charts to your documents with Document Generation for Mendix can enhance data visualization and presentation. Follow these steps to implement charts in your document template:
DS_Pie Chart:
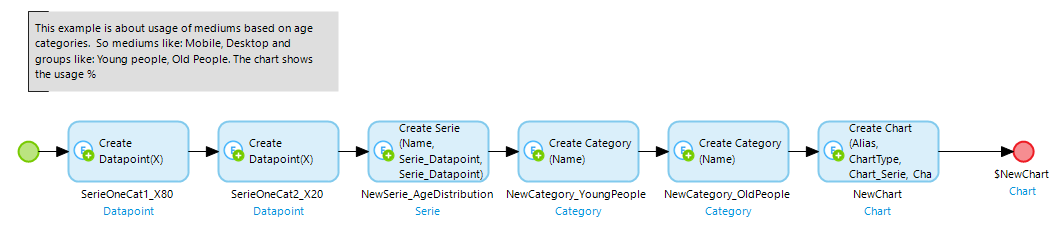
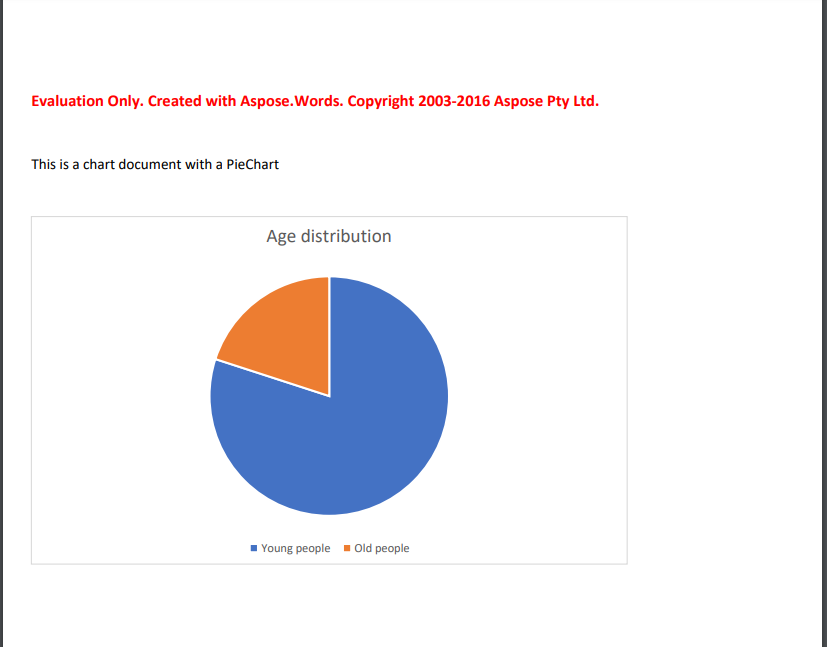
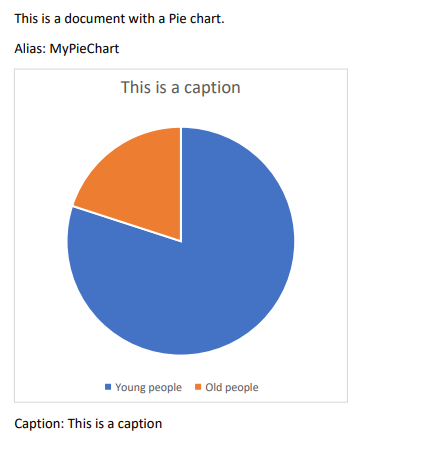
Example Pie Chart:
 "In the
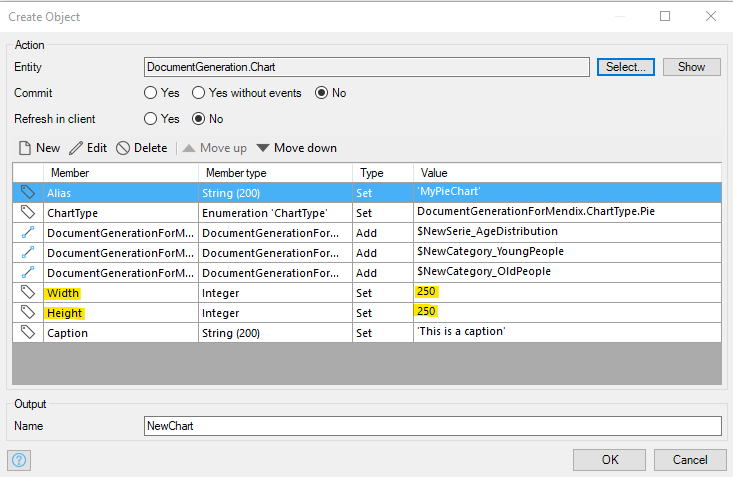
 Chart object, you can define specific parameters. Use the ChartType attribute to determine the type of chart to generate. The Alias attribute value will be referenced later in your TemplateConfiguration.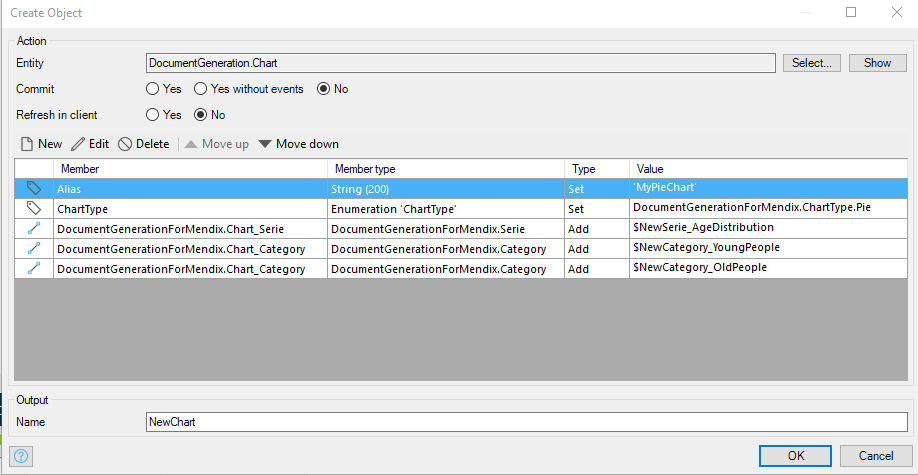
In your existing or new TemplateConfiguration, add DS_PieChart under the tables section:
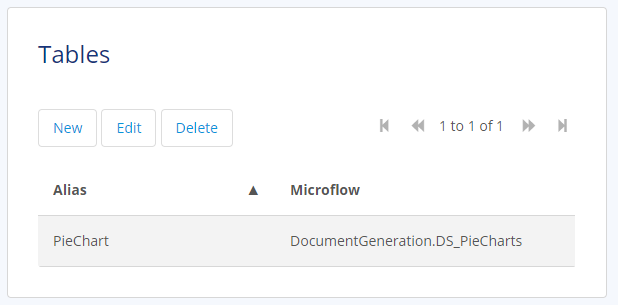
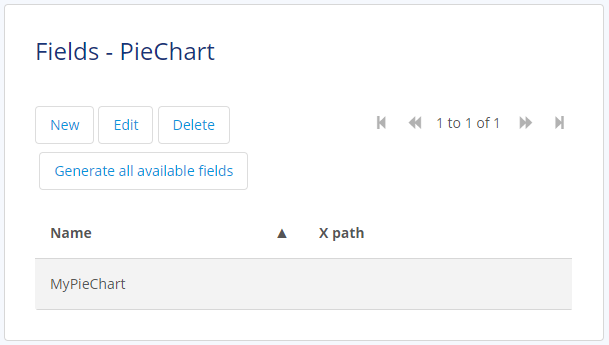
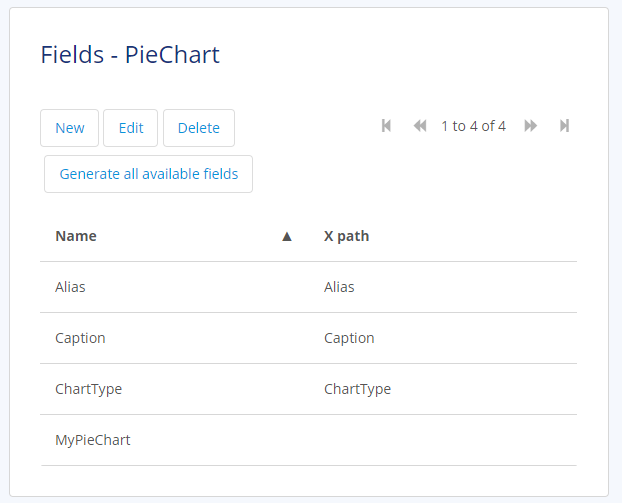
Under the Fields section of the PieChart table, add your chart's Alias. If your Alias is 'MyPieChart,' the Field should be 'MyPieChart.' No XPath value is needed.
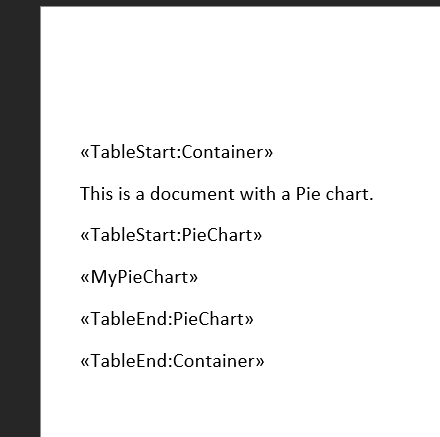
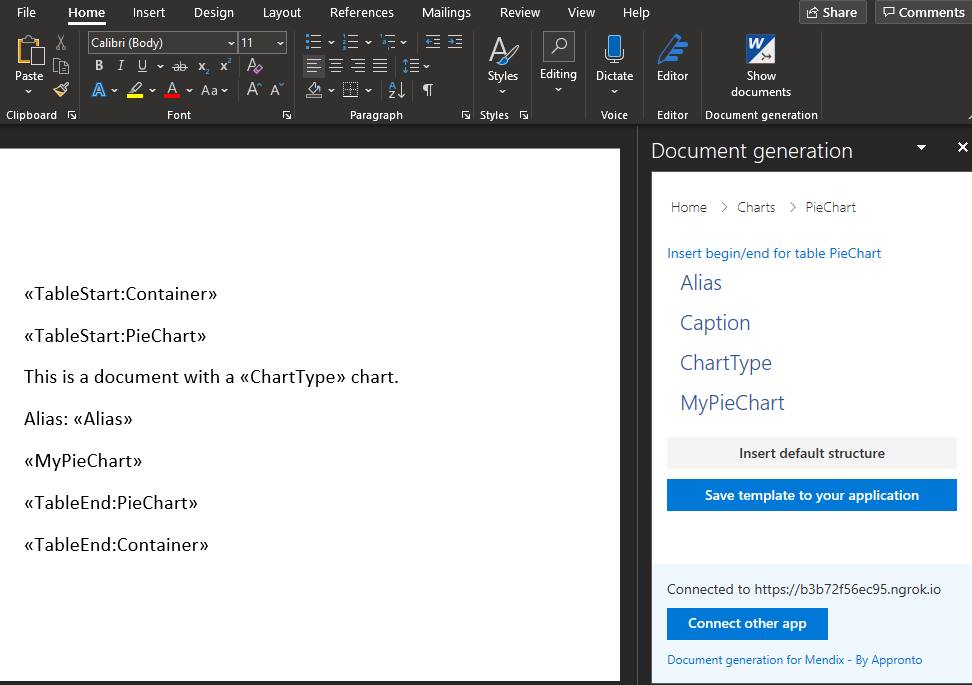
Save the TemplateConfiguration. Then, open Microsoft Word and use the DocumentGeneration add-in to edit your DocumentTemplate. Insert the PieChart table element, and place the «MyPieChart» merge field within it.
Save your DocumentTemplate to your application and confirm the changes. Now, proceed to generate your document using a microflow and AdvancedMerge.
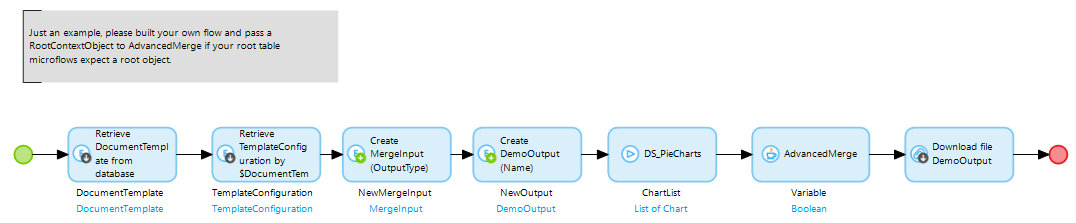
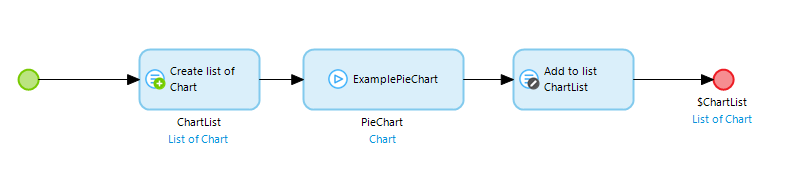
Configure the AdvancedMerge Java action, ensuring that the ChartList is passed in:
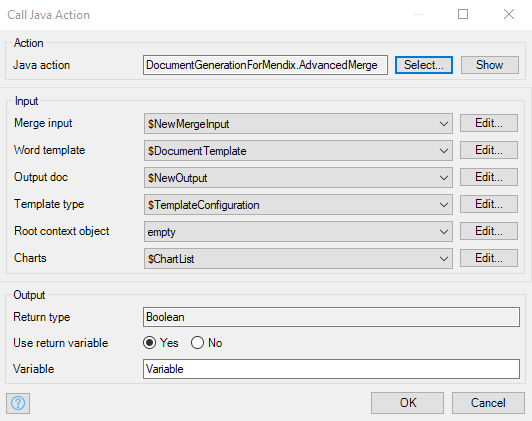
The result will be a document that includes the chart:
Enhance Your Functionality
Additional attributes of DocumentGenerationForMendix.Chart (or its specialization) can also be accessed via the TemplateConfiguration:
Additionally, attributes can be accessed through the add-in in Word:
Generated Document:
Adjust the width and height attributes in your Chart object to control the dimensions of the image: